
Kickoff — March 11th, 2022 — real-world internet performance on NTEC fiber is asymmetrical in the extreme
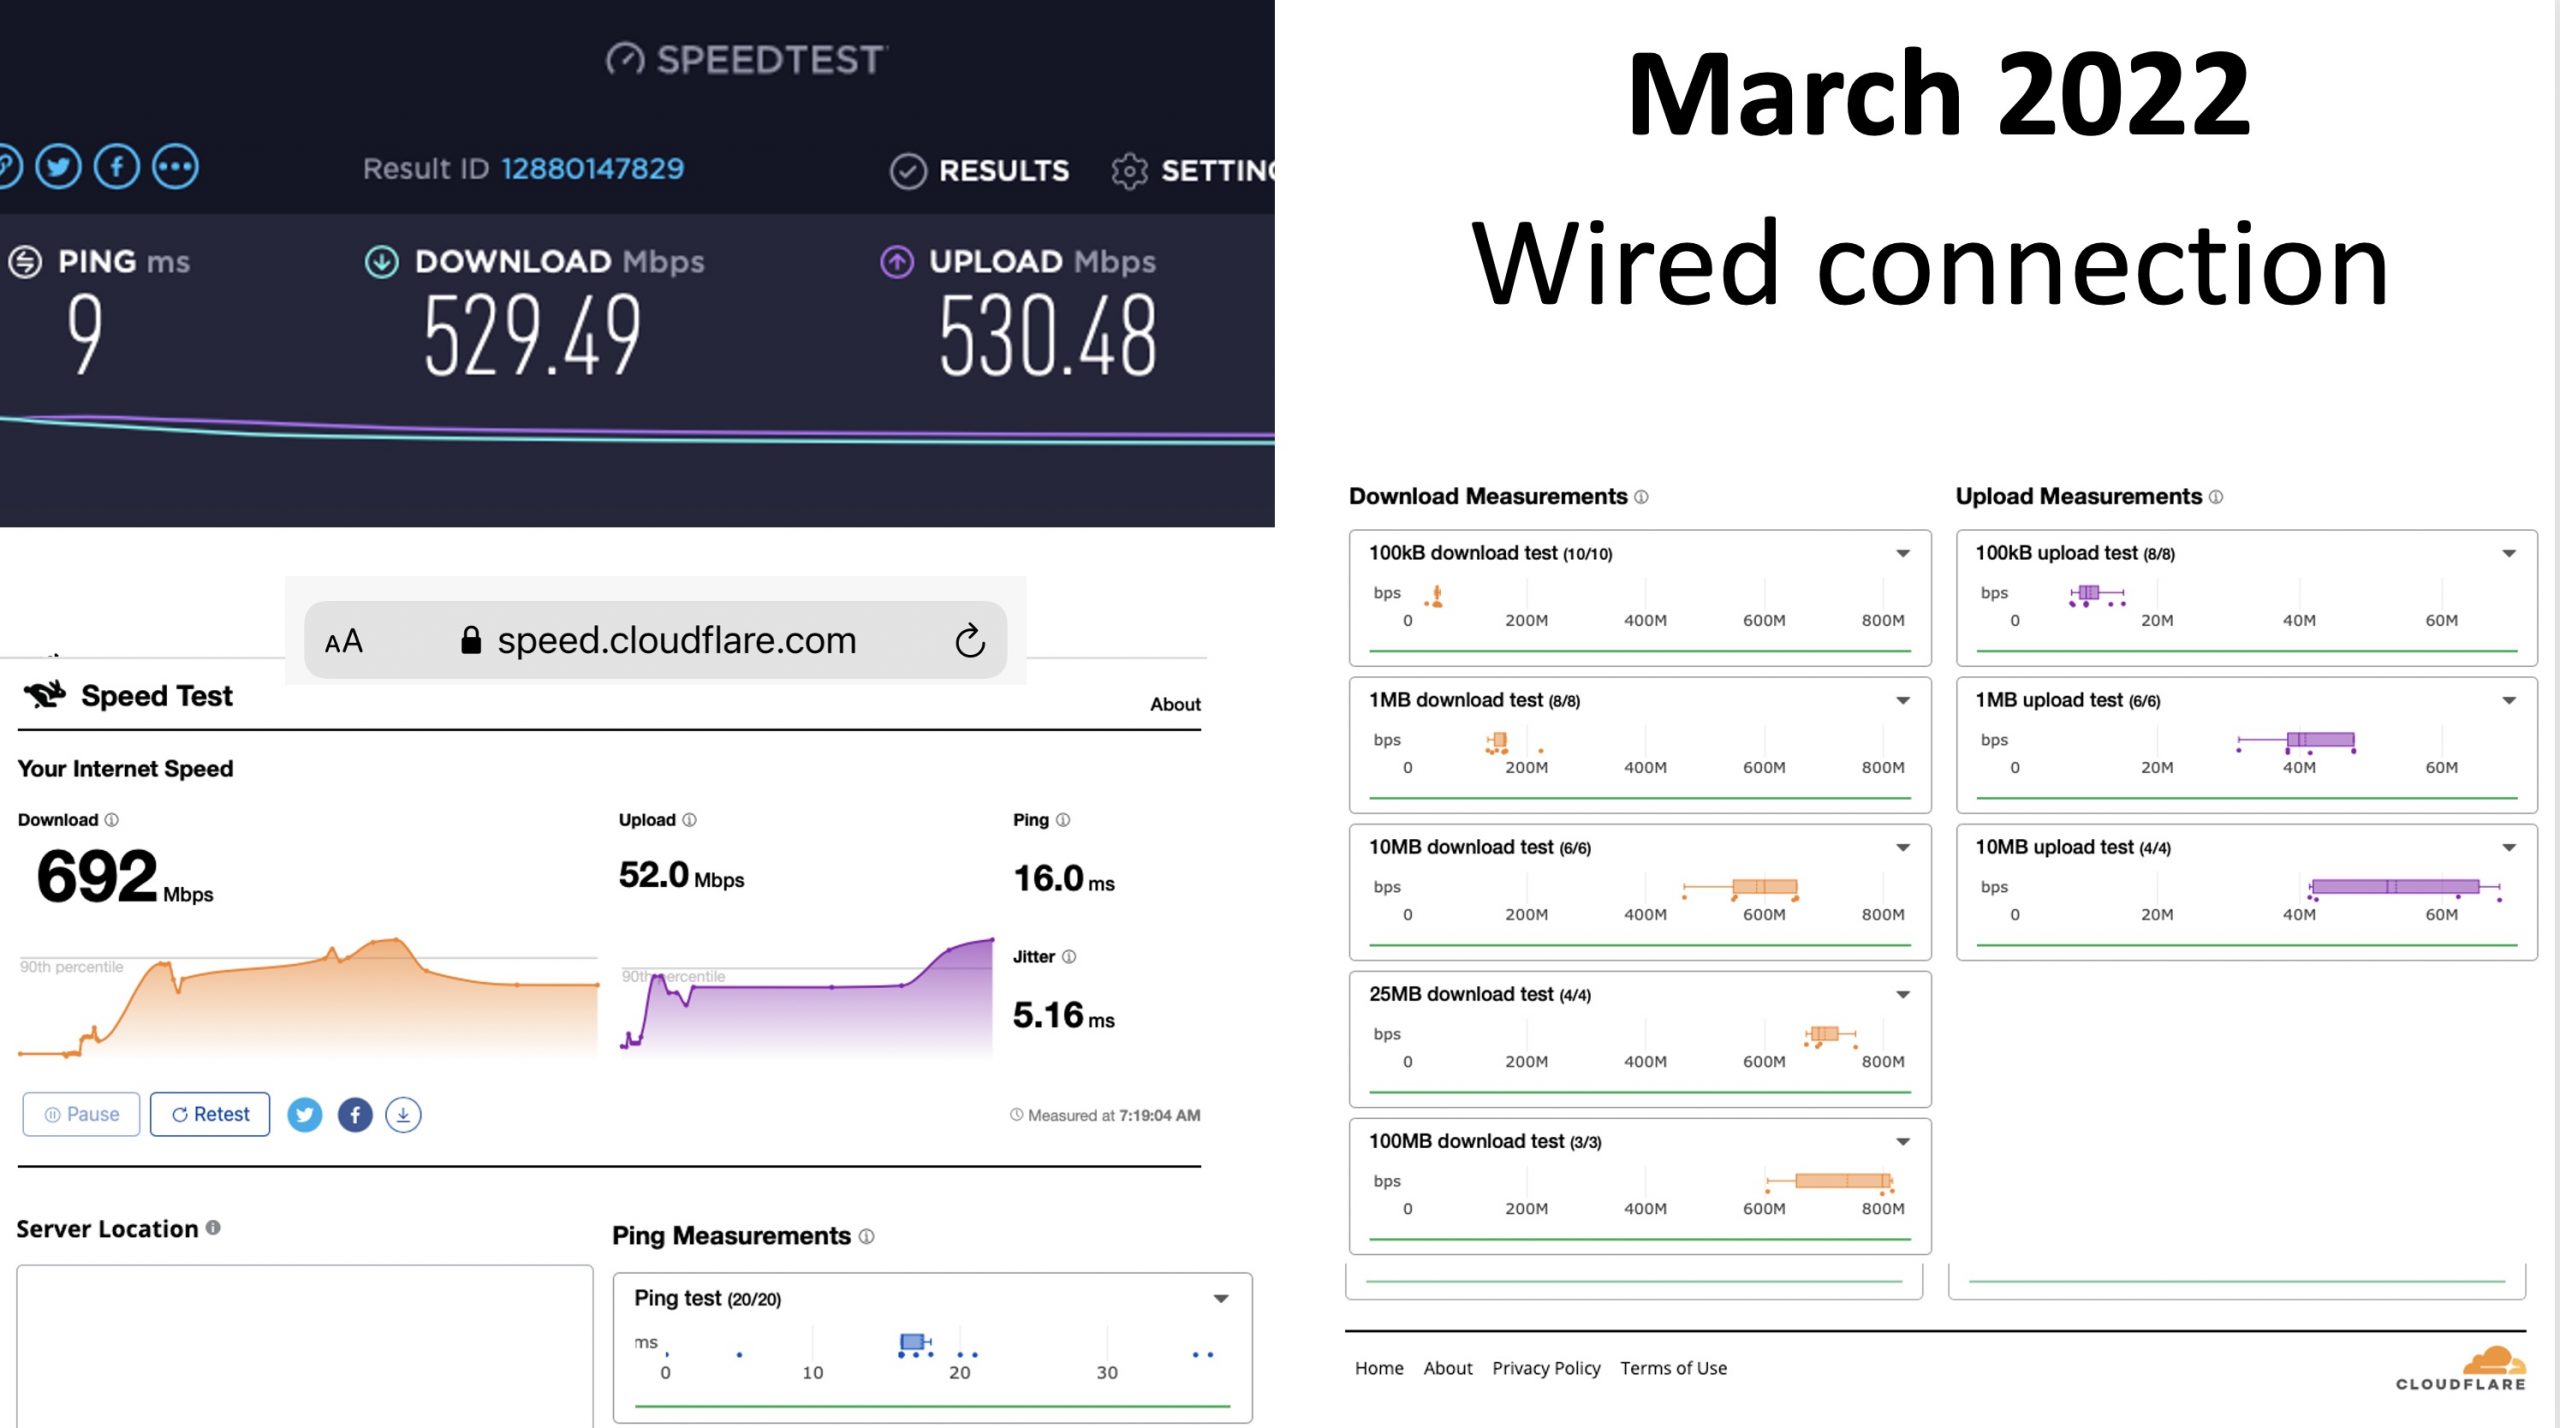
Here’s the test from a year ago. Speedtest is roughly symmetrical, as is Cloudflare’s more extensive (and useful) test between my place and their Twin Cities location.

Here are the same tests as of this morning. Same computers, same place in the LAN, recently-restarted router, switches and hubs, same computer, same cables.
Very similar results from Speedtest. But Cloudflare tells a different story. My traffic is now being routed to Cloudflare-Chicago rather than Cloudflare-MSP (confirmed with a plain old Traceroute). Download speed is comparable but upload speed is now substantially lower.
This could be caused by all kinds of things. Here are possibilities that come immediately to mind.
- Routing changes — why is traffic going to Chicago rather than the much-closer Twin Cities port?
- Traffic-shaping changes — why is upload speed for smaller files so much slower?
- Testing methodology changes by Cloudflare — possible, but I tested from a server I have in the IPHouse datacenter and got comparable results to what I saw several years ago)
- Differences in data-center performance — this is concerning, if this is my new default route out to the wider internet.
Something has changed. I don’t believe anything in my network or use has. So I’m trying to figure out where the problem is and get it fixed.
Update — March 23rd, 2022 — good news and bad news
- Good news — routing is fixed to Cloudflare MSP so tests are now back to normal 8ms latency
- Bad news — bandwidth is still asymmetrical
Today I decided to try some other speed tests to see if this is just an artifact of Cloudflare’s methodology. Here are a series of screen grabs of them.
Baseline is Ookla, which is… Ookla. It’s test is weird in many ways that I doubt regulators comprehend. As always, it’s perfect. Weirdly perfect. In addition to the screen-grabbed test, I tried some other locations:
Pierce Pepin Coop (the default) — 529.43 down 530.90 up
US Internet (Minneapolis) — 530.38 down, 527.18 up
Speedtest.net — 530mb up, 530mb down
But here are all the rest. First up is Cloudflare — after running all the other ones, I understand why Cloudflare’s methodology is so hard on my current configuration. It quits pretty early in the slowly-increasing uploads. Some of the following tests are a little more patient and give better readings. And, as you will see in the subsequent update (about the new draft internet standard for network testing), it may be a little too demanding in its latest configuration.
Speed.cloudflare.net — 657mb down, 39mb up
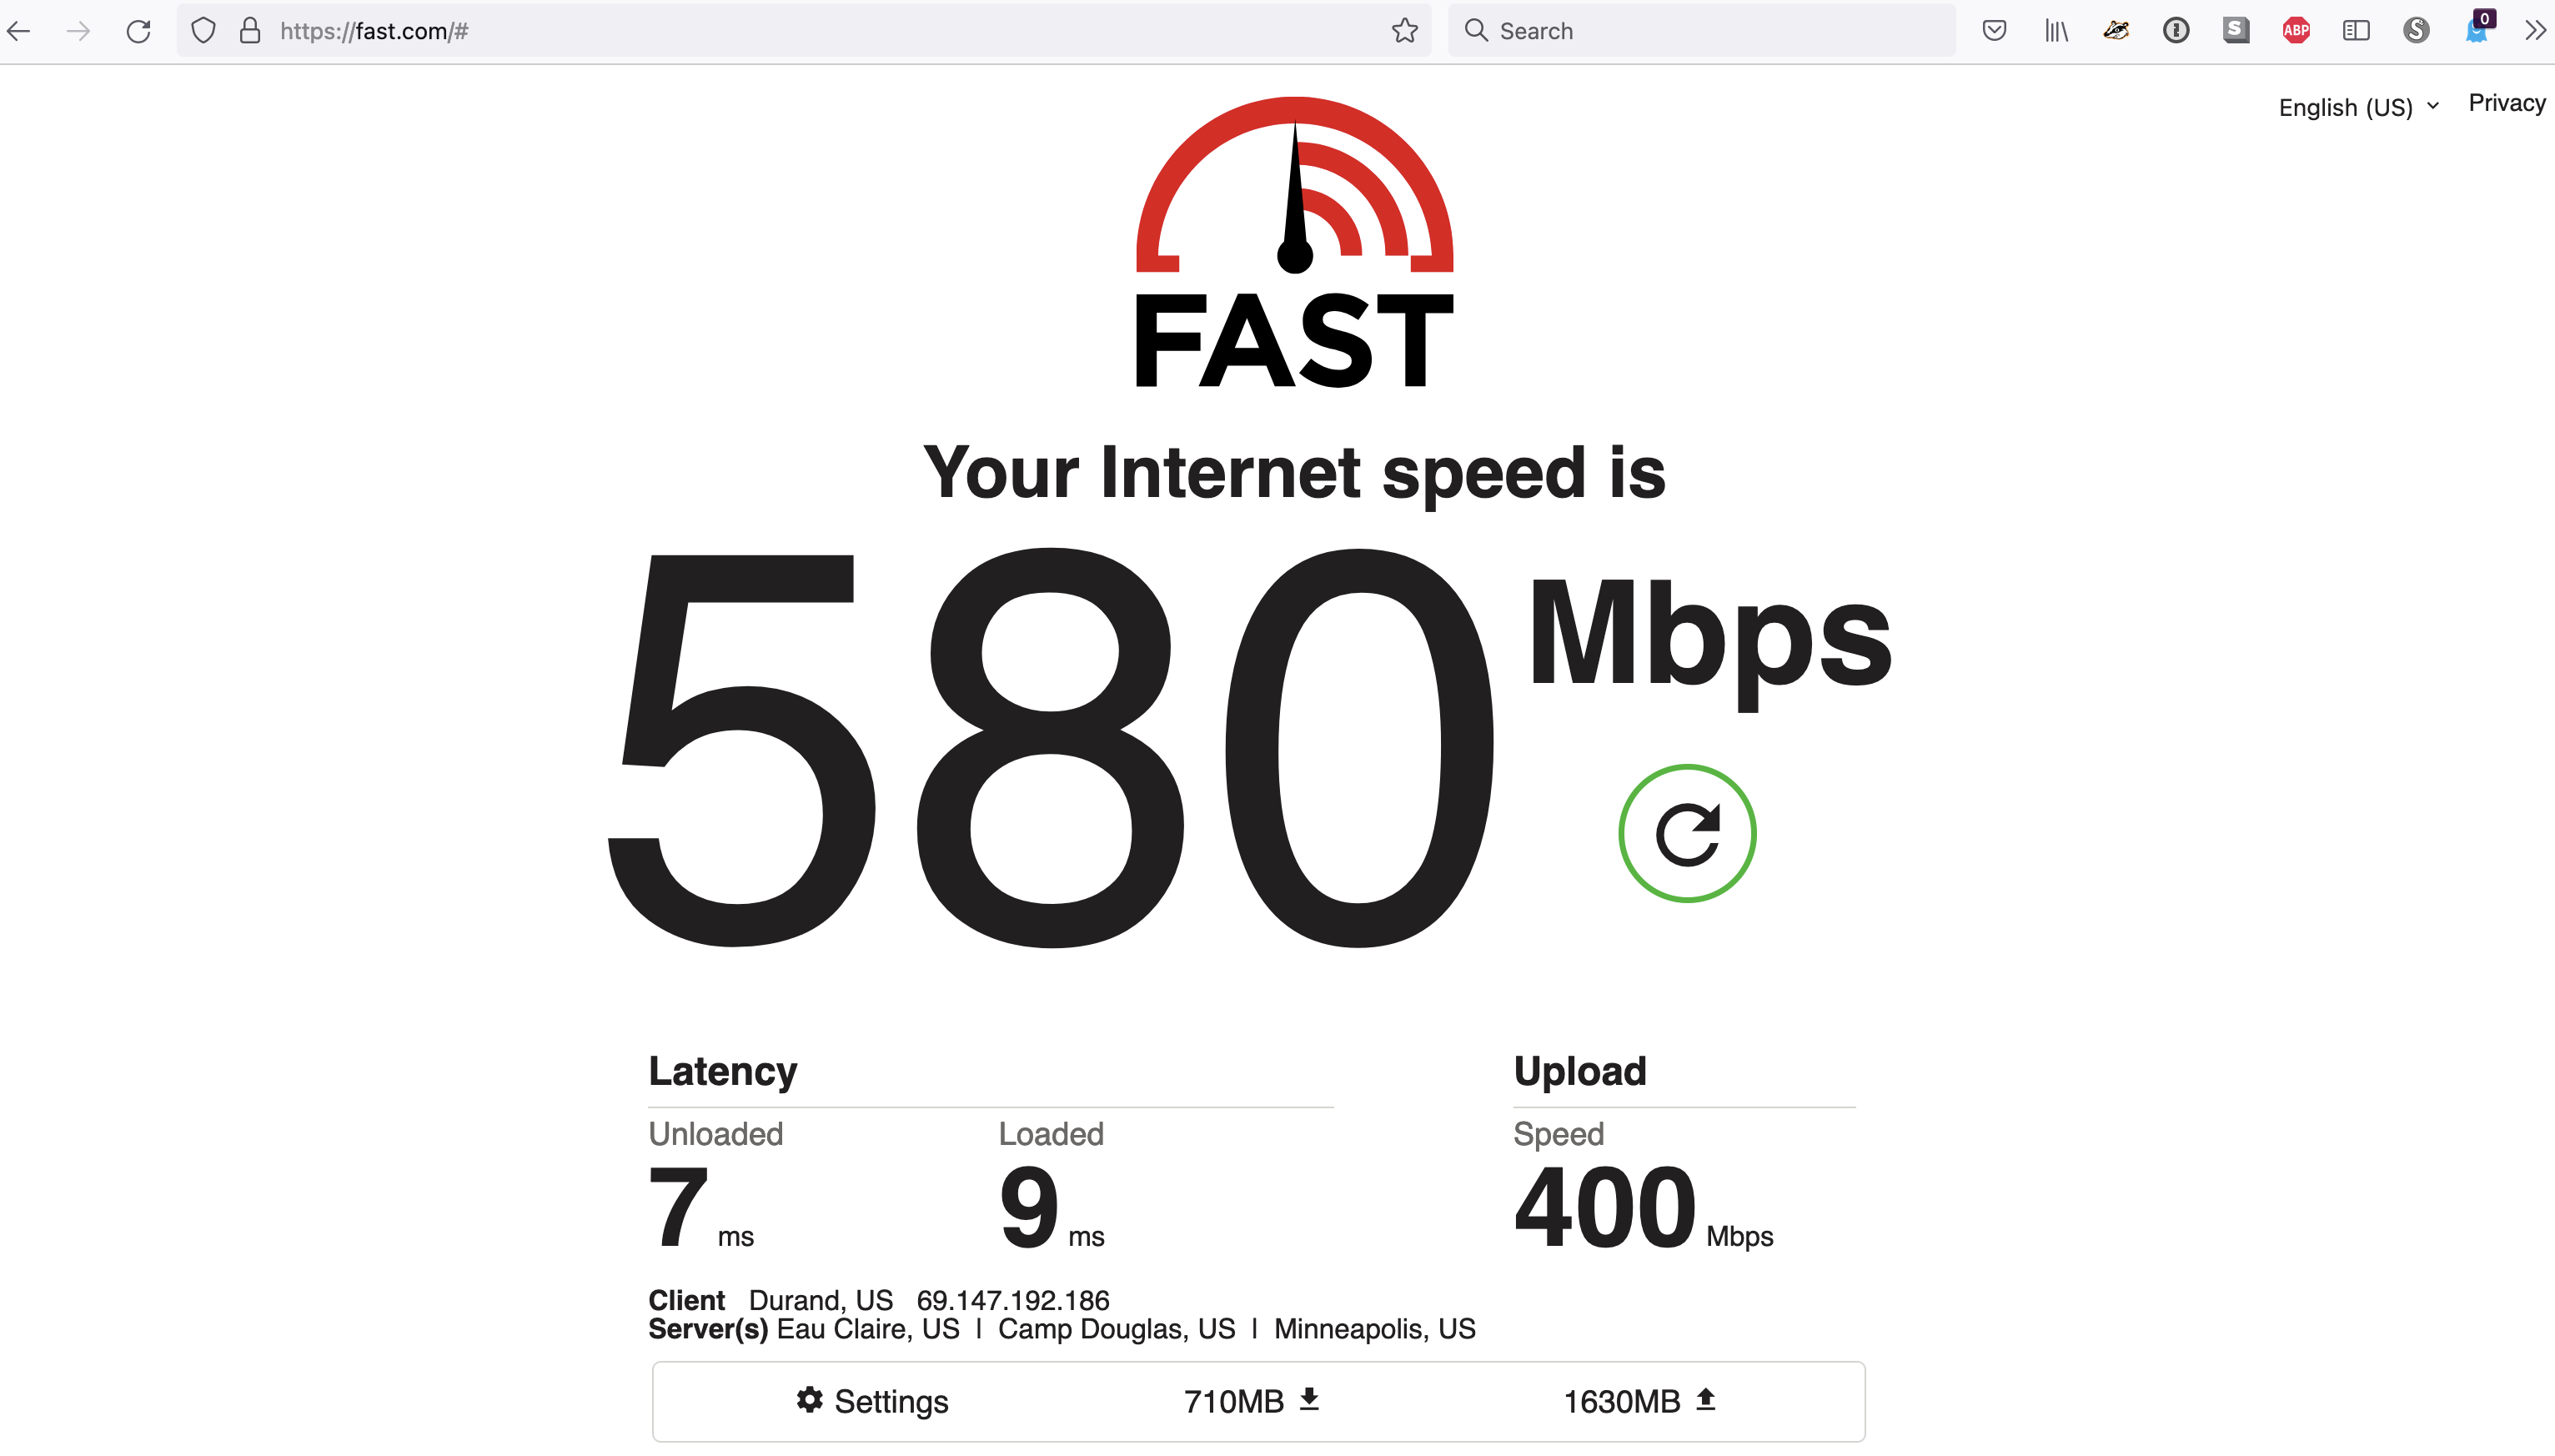
Fast.com — 580mb down, 400mb up
SpeedOf.me — 350mb down, 80mb up
Speedcheck.org — 450mb down, 200mb up
Open Speed Test — 500 mb down, 375mb up
Bredbandskollen.se – 500mb down, 100mb up
Update — March 23th, 2022 — New RFC for network testing — and the discovery that MacOS Monterey has a built-in network testing tool that conforms to that draft-standard.
Here’s a link to a new internet draft standard for IP performance measurement called the “RPM test.” This is the Abstract.
Responsiveness under Working Conditions
draft-ietf-ippm-responsiveness-00

Abstract

For many years, a lack of responsiveness, variously called lag,
latency, or bufferbloat, has been recognized as an unfortunate, but
common symptom in today's networks. Even after a decade of work on
standardizing technical solutions, it remains a common problem for
the end users.

Everyone "knows" that it is "normal" for a video conference to have
problems when somebody else at home is watching a 4K movie or
uploading photos from their phone. However, there is no technical
reason for this to be the case. In fact, various queue management
solutions (fq_codel, cake, PIE) have solved the problem.

Our networks remain unresponsive, not from a lack of technical
solutions, but rather a lack of awareness of the problem. We believe
that creating a tool whose measurement matches people's every day
experience will create the necessary awareness, and result in a
demand for products that solve the problem.

This document specifies the "RPM Test" for measuring responsiveness.
It uses common protocols and mechanisms to measure user experience
especially when the network is under working conditions. The
measurement is expressed as "Round-trips Per Minute" (RPM) and should
be included with throughput (up and down) and idle latency as
critical indicators of network quality.
Better yet, a working version of this tool has been included in Apple’s newest versions of macOS and iOS. Here’s a link to a how-to on those two tests.
I just ran the MacOS version on a Monterey M1 Mini. It shows the same pattern as all the non-Speedtest ones. Slowly rising upload speeds. This test is more patient than most, so it eventually arrives at a perfectly satisfactory reading. The thing that’s interesting is the way that it arrives. For that, we need to return to the RFC.
4.1.3. Reaching saturation

The RPM Test gradually increases the number of TCP connections and
measures "goodput" - the sum of actual data transferred across all
connections in a unit of time. When the goodput stops increasing, it
means that the network is used at its full capacity, meaning the path
is saturated. At this point we are creating the worst-case scenario
within the limits of the realistic traffic pattern.
OK, on to the test. If you are running Monterey on a Mac, launch the “networkQaulity” command in a terminal session. Note the capitalized Q in the middle. Here’s what it looked like when I ran it just now.
MacOS Monterey networkQuality — 489mb down, 401mb up
I like this test for several reasons. I like the public methodology of an RFC. I like that the test defaults to doing the upload and download tests at the same time, to better saturate the network. And I like the results. I’m about ready to chalk this up to differences in testing methods.