
Intro
Exactly five years ago today, I published this little rant about the growth rates projected for the new “generic top level domains” that were being introduced by ICANN at the time. You know, domain names that end in things like .run or .lol or .bot (yep, those are all real alternatives to .com or .org if you’d like to strike out into new territory).
I decided to update it with the way things have turned out.
Original post – March 7, 2014
I was reading the Appendices of a recent ICANN report when I came across an interesting assumption built into their analysis. The boffins that did this portion of the study are projecting 22% annual growth in total domains for the next five years.
Here’s the reference that caught my eye:
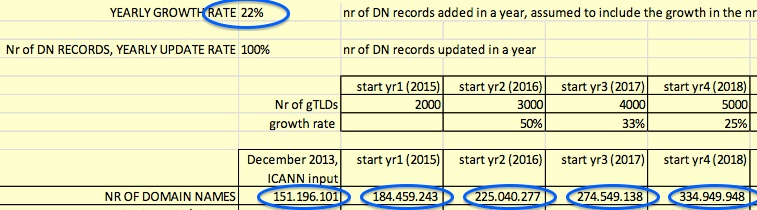
You can find this on page 150 of the newly-released Whois study — done by the Expert Working Group on gTLD Directory Services. Here’s the link to the study — https://www.icann.org/en/system/files/files/final-report-06jun14-en.pdf
The thing that struck me was that whopping 22% annual growth rate. Partly this is due to some pretty optimistic assumptions about the growth in the number of new gTLDs (I’m willing to bet any money that the beginning of 2015 will not see 200,000 gTLD domains in the root). But leaving that aside, 22% year over year growth isn’t something we’ve seen since pre-bubble glory days.
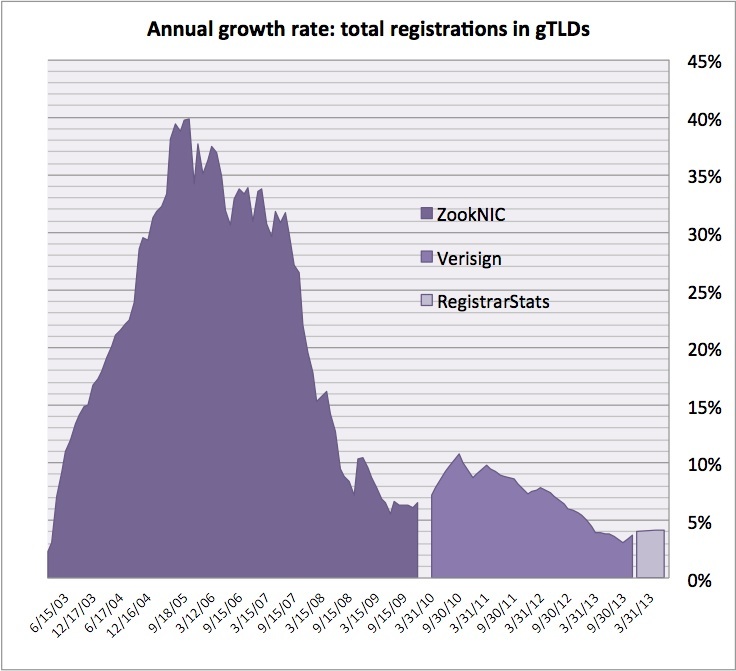
Here’s a little chart I put together to show you the history. We’re running about 4% growth right now. A long way from 22%. If I were building budgets for ICANN, I’d be seriously researching where these projections are coming from and applying a pretty serious quantity of cold water. Just saying…
UPDATE: March 7, 2018
I decided to update this post given that we’re at the end-point of that projection that caught my eye (start of 2018). Here’s my last version, as of the end of 2017 – the first two chunks are the same, the reddish one is what happened.
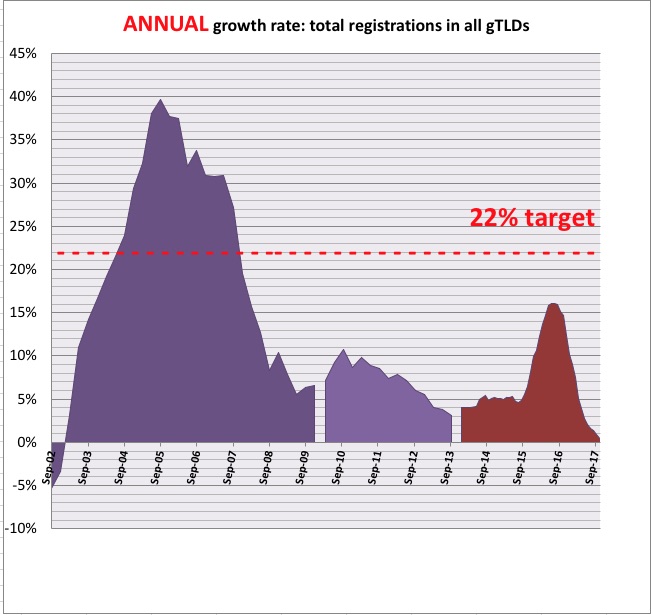
I think this falls in the “not even close” zone. New gTLDs never approached 22% a year growth and no new rounds of gTLDs have been added since the first batch of 1000 or so hit. Yep, toward the end, the growth rate was headed for negative territory as lots of the aggressive “first year for free” domain names weren’t renewed. The world needs a zillion new subsequent-round gTLDs exactly… why?
Notes to the nit-pickers:
- The assumptions were in a scoping study done by IBM to determine how much a system would cost — so these numbers could have been pretty old, given how long the EWG had been running. I worried at the time that ICANN was using similarly optimistic numbers in their budget projections. Looks like they did, as they’re in retrenchment mode right now.
- These numbers do not include ccTLDs (since IBM didn’t)
- Verisign was quite far behind in publishing their quarterly statistics reports, so I finished up with RegistrarStats data. No warranty expressed or implied, especially since the site was decommissioned just as that annual growth rate started to approach zero.
- Here’s a link to the 2018 version of the file that creates the charts. The payday tab is the first (far left) one — cleverly-named “Sheet 1” — which contains the data, the calculations and the charts. Warnings. The layout is ugly, the documentation is sparse. The “Notes” page has URLs for the data sources although they may not work any more. The rest of the tabs are (some of) the (erratic, sortof-monthly) downloads from RegistrarStats. Click HERE for the file (about 1 mByte).